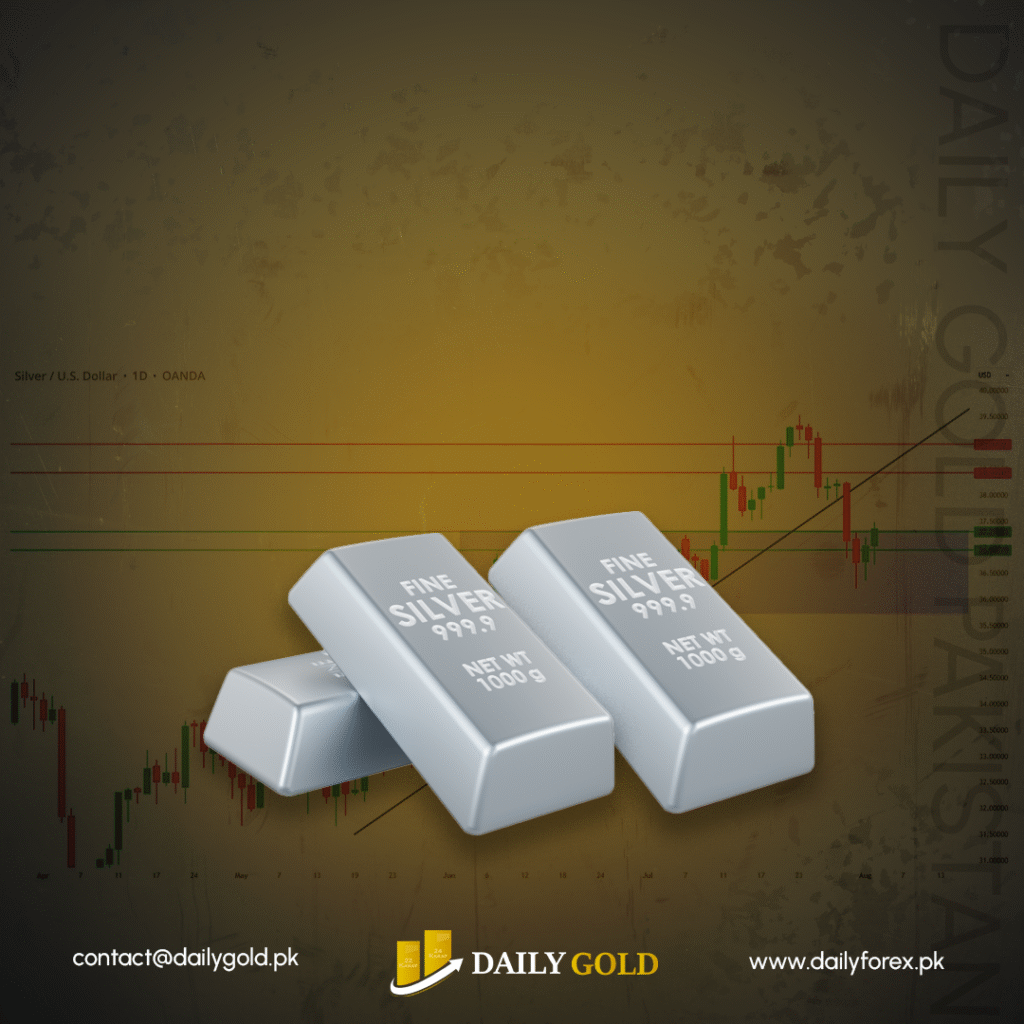
Silver (XAG/USD) extended its decline for the fifth straight session during Wednesday’s Asian trading, slipping toward $37.20 per troy ounce. The technical setup highlights sustained downside pressure as the metal consolidates inside a descending channel pattern, signaling a stronger bearish outlook.
Technical Overview: Bearish Momentum in Focus
- The 14-day Relative Strength Index (RSI) remains below the key 50 level, reinforcing the negative bias.
- Silver is trading under the 9-day Exponential Moving Average (EMA) at $37.75, indicating fading short-term bullish momentum.
- The immediate support lies at the 50-day EMA around $37.11. A confirmed break below this mark could accelerate declines toward deeper support levels.
Key Support Levels
- $37.11 (50-day EMA): Immediate support zone currently under pressure.
- $35.70: Lower boundary of the descending channel.
- $35.28: The 11-week low recorded on June 24.
- $32.96: A three-month low that may come into play if bearish momentum intensifies further.
Failure to hold above these levels would expose silver to deeper declines, confirming a strong bearish structure in the medium term.
Resistance Levels to Watch
On the upside, silver faces immediate hurdles before any recovery can be confirmed:
- $37.75 (9-day EMA): First short-term resistance.
- $38.70: Upper boundary of the descending channel.
- $39.53: A critical resistance and multi-year high from July 23, marking the strongest rally since 2011.
A break above this zone would shift momentum back in favor of buyers and potentially open the path toward fresh highs.
Outlook for Silver (XAG/USD)
For now, silver remains pressured by weak technical signals and a stronger U.S. Dollar backdrop. Unless bulls reclaim $38.60–$39.00, the bias is expected to remain bearish with a focus on the $35.00–$36.00 range in the near term. However, any rebound above the descending channel could reestablish long-term bullish momentum.
🔗 For live silver price updates and expert analysis, visit www.dailygold.pk

